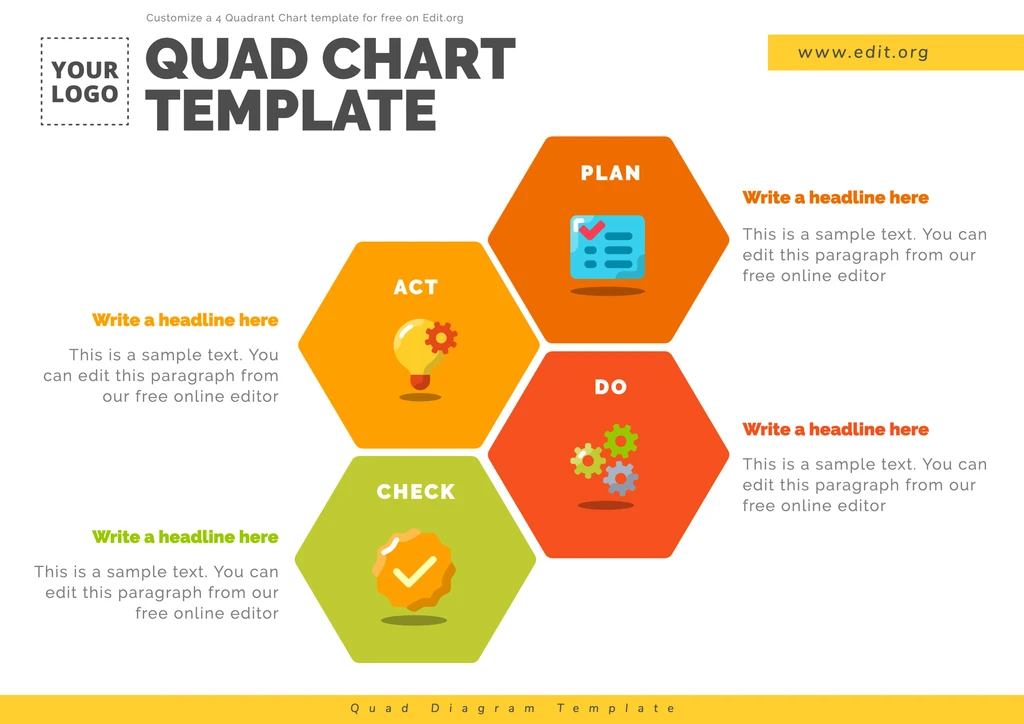
Customize a quad chart example for meetings, workshops, and university presentations. Write data inside the boxes, change the colors, and include photos or your company logo. Download quad charts to print in high resolution or to share on social media.
Edit Quad Chart Powerpoint templates
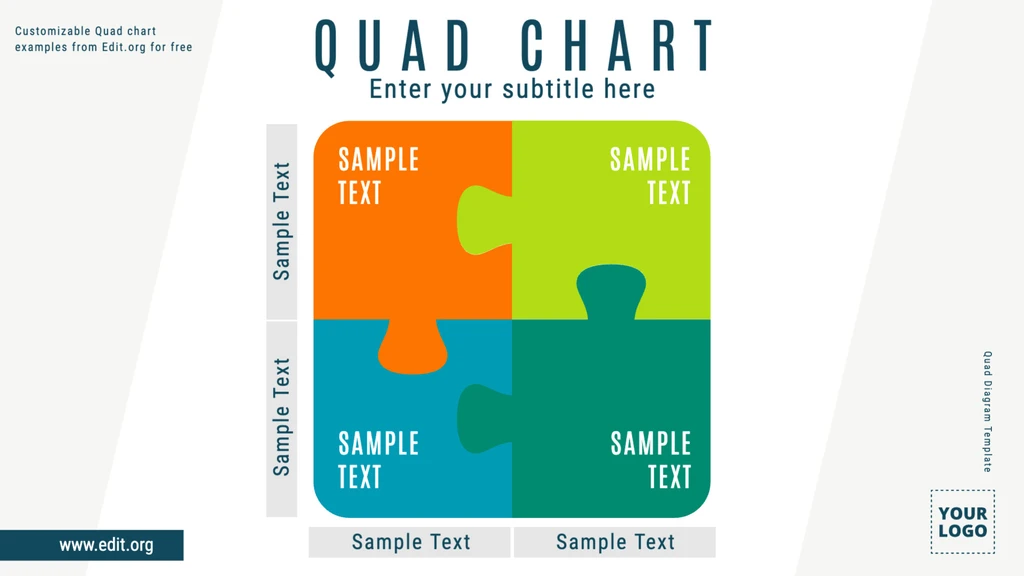
Do you want to create a diagram with squares? Do you want to customize a pre-design to explain or make a comparison in a meeting?
Easily create a diagram from our free online editor with a professional result and no need to download a paid app. The process will be fun and intuitive.
Access our online quad chart generator right now from your cell phone, tablet, or computer.
Design an infographic with four squares as a slide to display in a professional presentation, share via email, or print in high-quality.
How to edit a 4 Quadrant Chart template online
See how easy it is to customize a 4 quadrants template!
- Click on the quadrants diagram you like best in the article. At the bottom, find more designs to choose from.
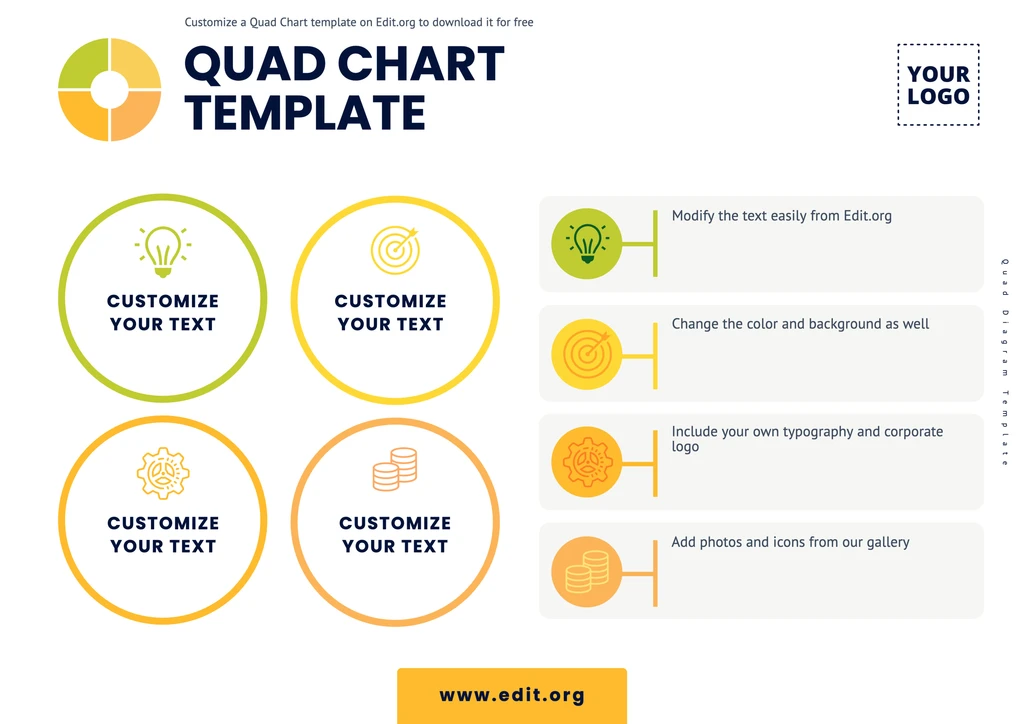
- Edit the quad slides according to your studio. You can write text inside each square or change the color, include your favorite typography, or your company logo.
- Save your four quadrant slide in the cloud associated with your free Edit.org account.
- Download the 4 section chart as a JPG or PNG to share on social media or as a PDF to print.
Done! See also these Gantt chart templates or these Swimlane diagrams.
Create Quad Chart examples to download
Use these project management quad chart templates in fields such as education, business, or science. Visually represent the purpose or overview of your project, as well as the problems, possible solutions, and expected benefits. Plan and visualize your priorities to help you manage projects.
From our graphical editor, you can add data, assign titles, explanatory paragraphs, and teach complex concepts through a graphical representation.
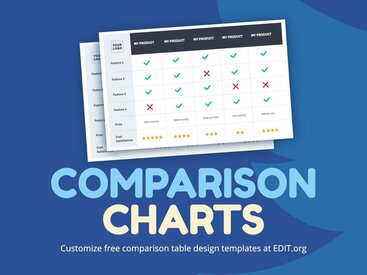
Also, create comparative charts to complement your Quad Charts.
Free Quad Chart templates to print in minutes
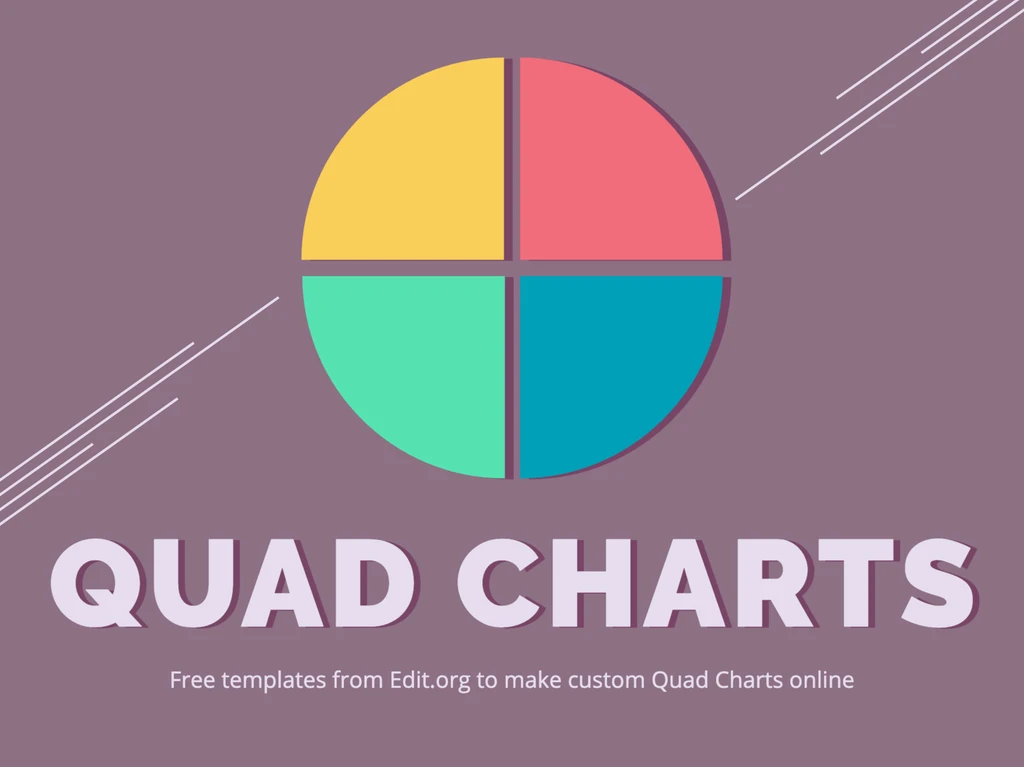
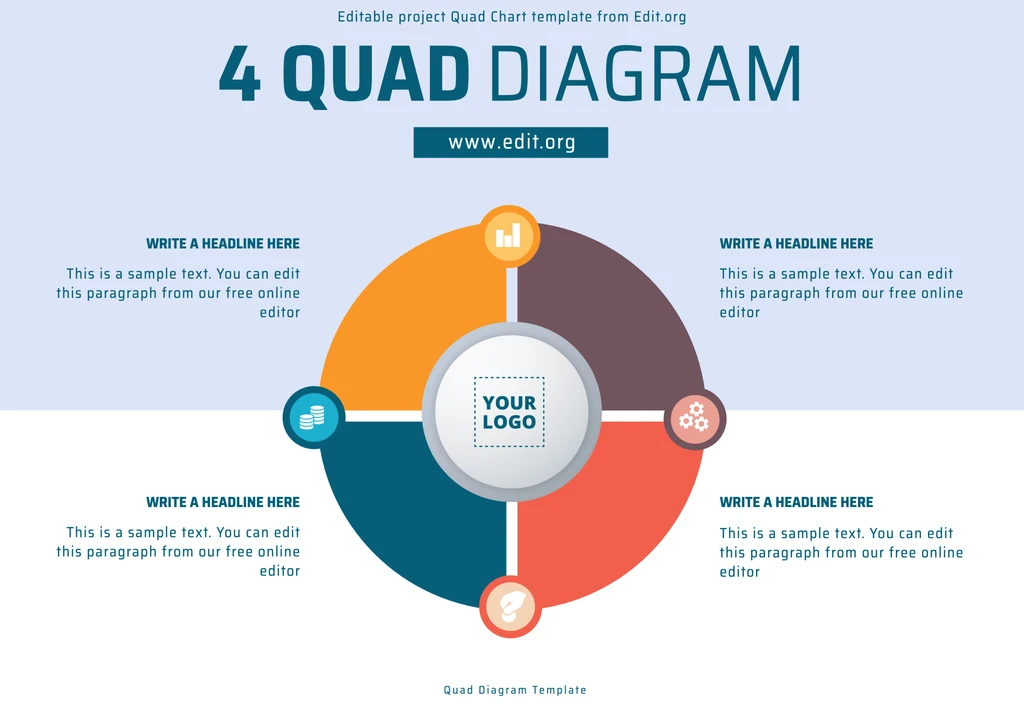
- What is a Quad Chart? It is a diagram that divides a space into four quadrants. Each of these quadrants shows a set of data. This precise division allows you to identify patterns, differences, and relationships visually.
It facilitates clear comparison and quick understanding for your audience. It also supports decision-making by presenting an in-depth analysis of complex information.
Enter our quadrant chart maker and edit a diagram with squares.