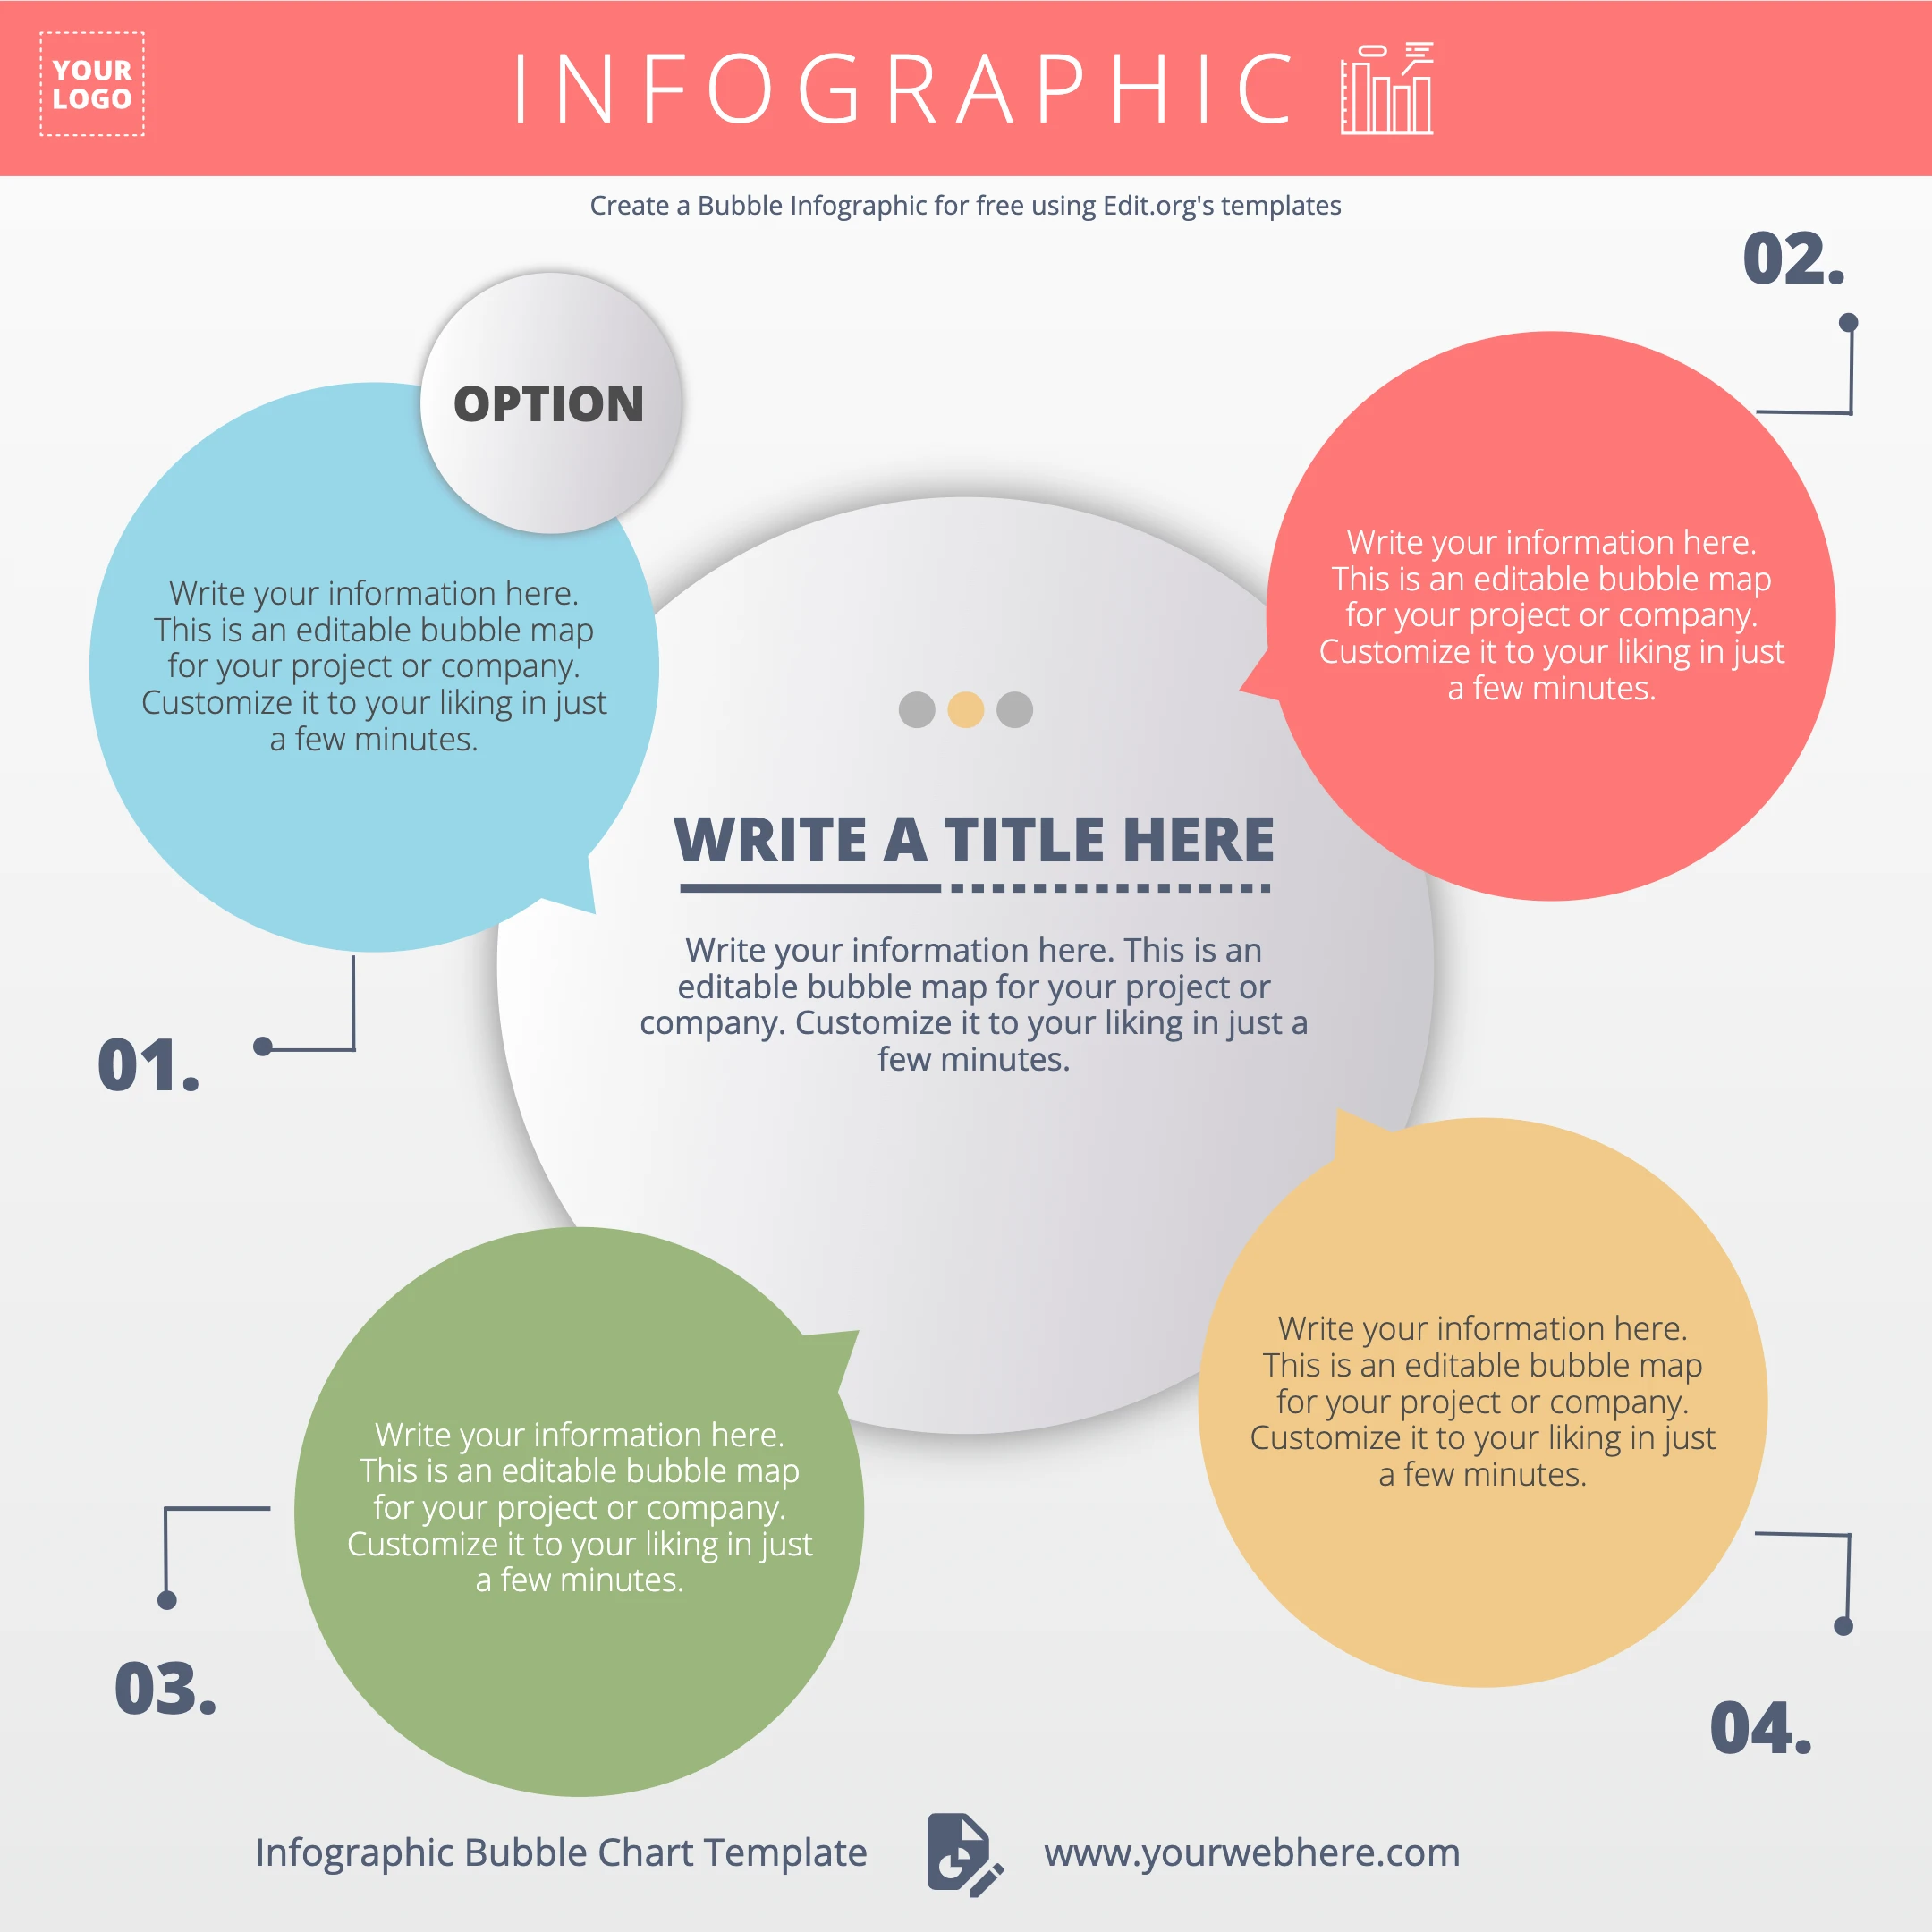
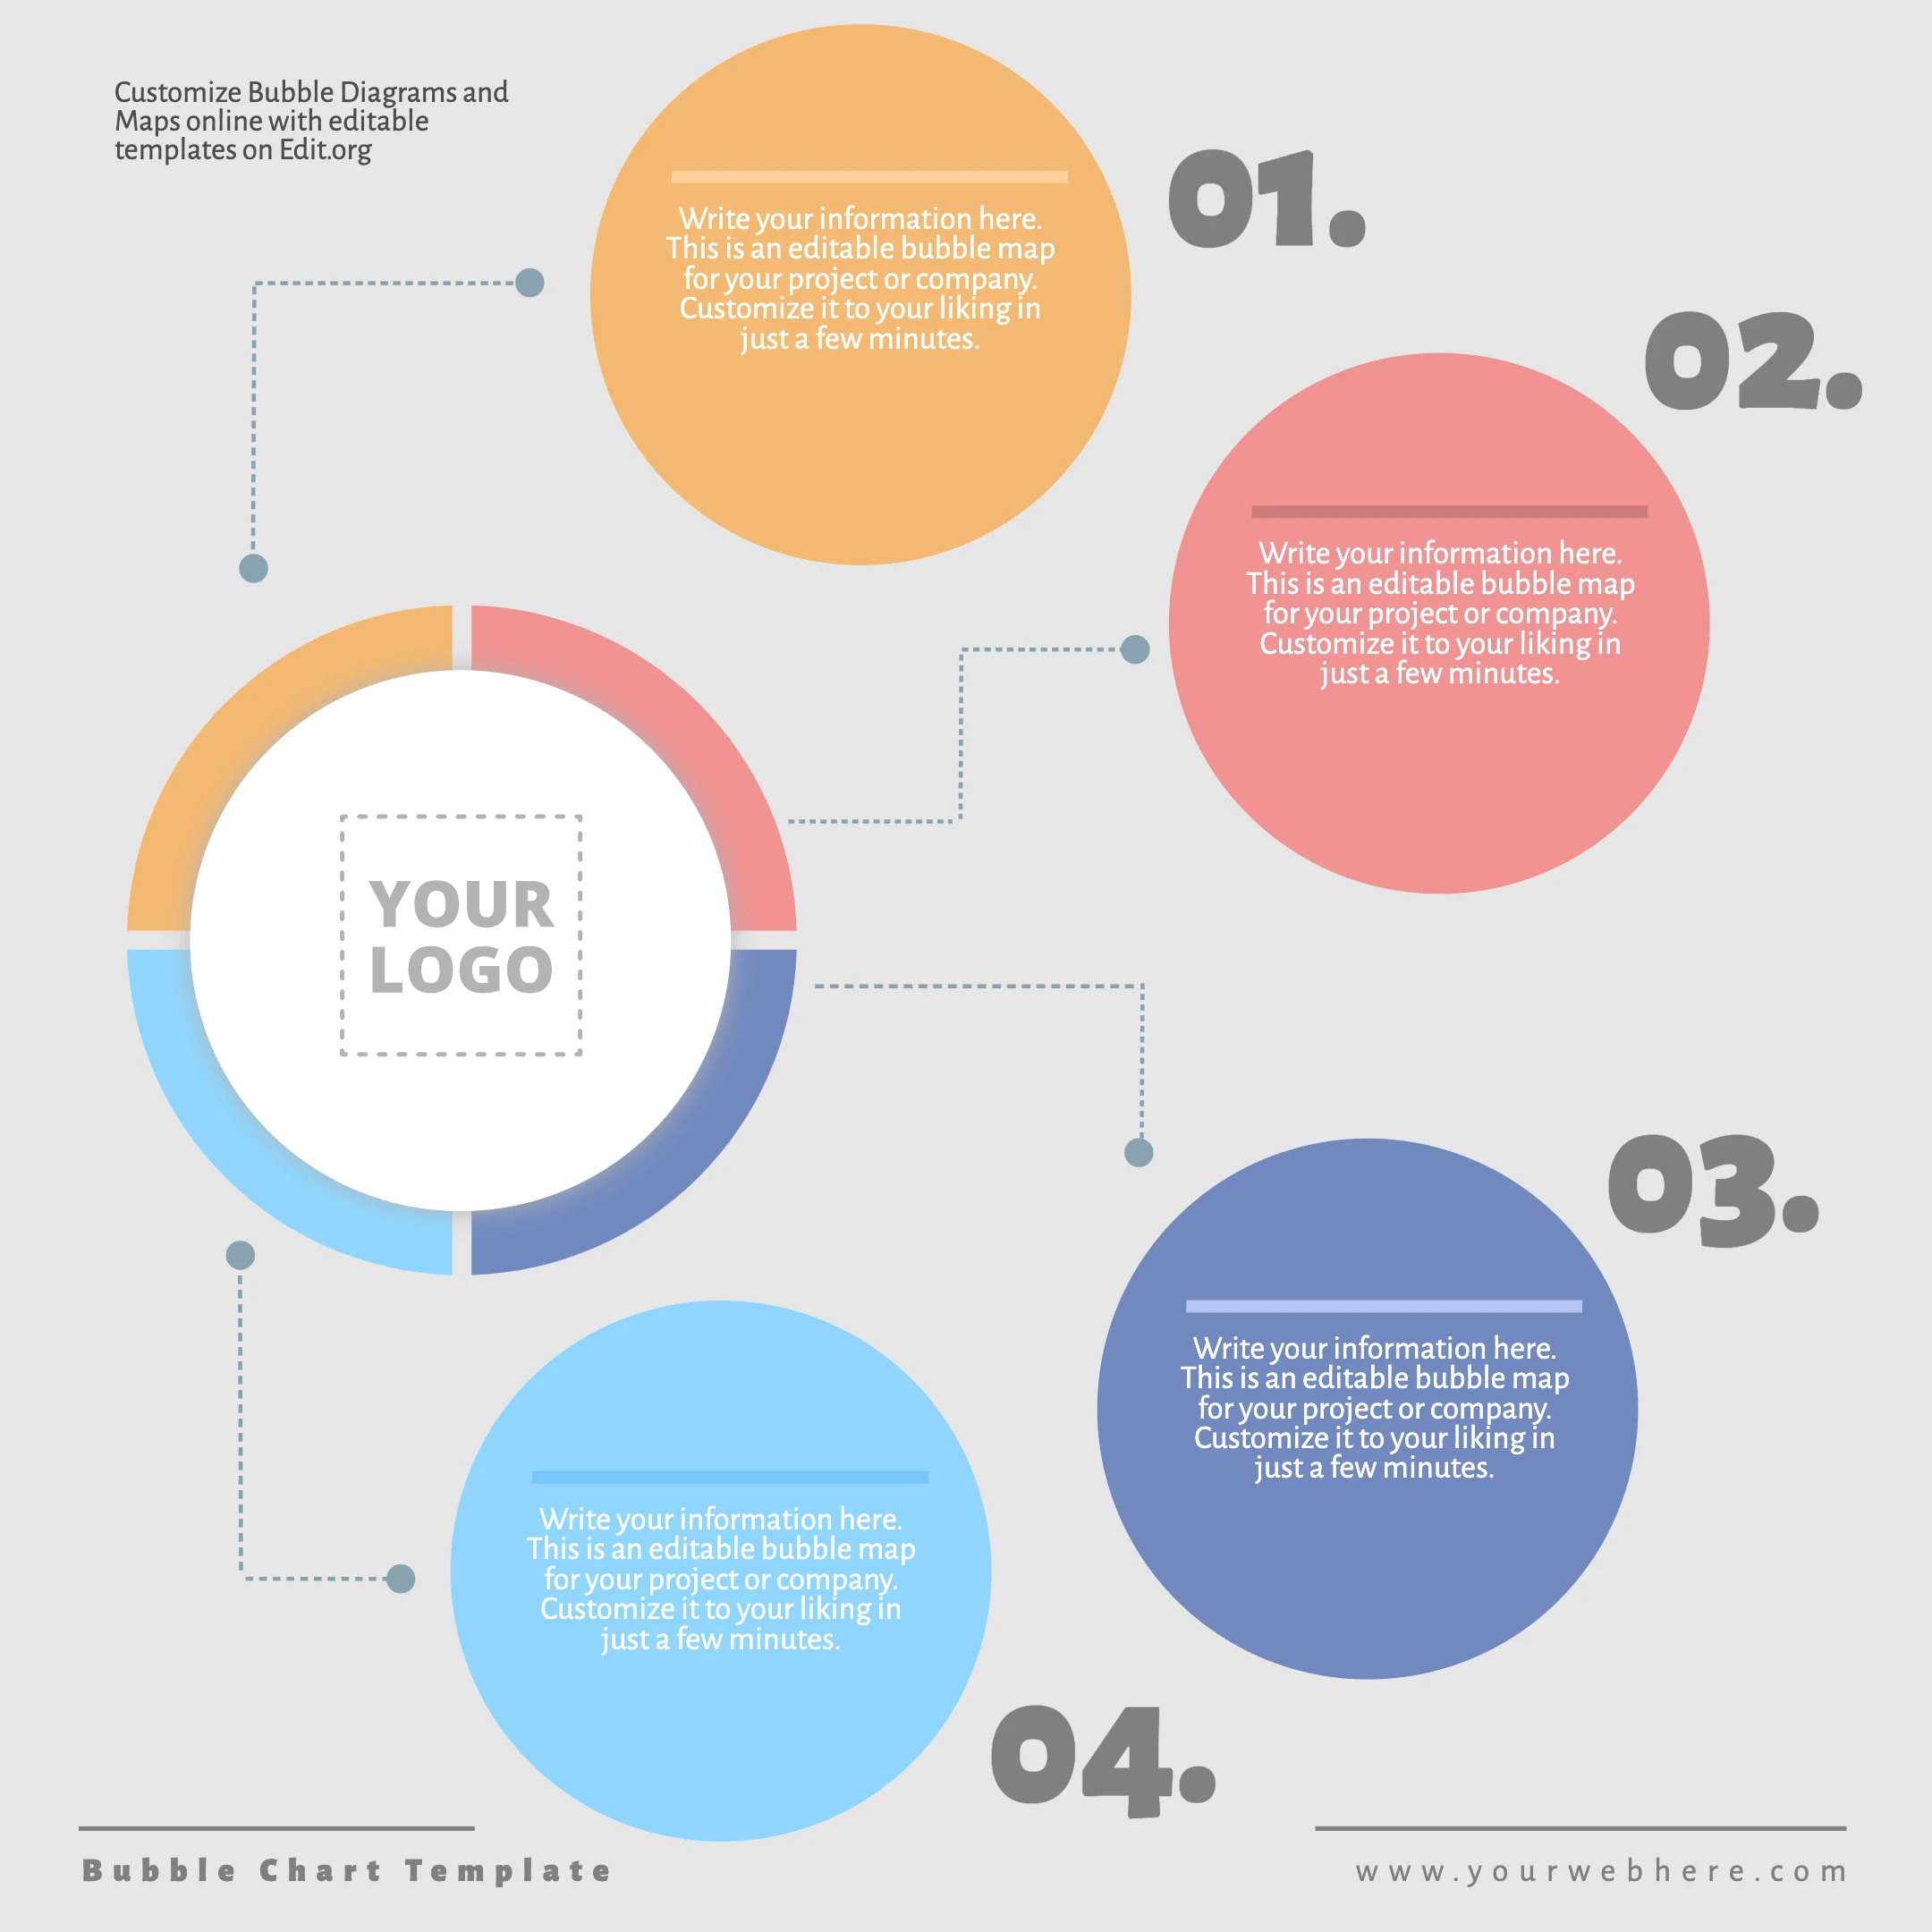
Customize bubble diagram examples online. Add all the elements you need, and change the colors and logo. Download a blank bubble map in high quality in just a few seconds.
Create a Bubble Diagram template to print
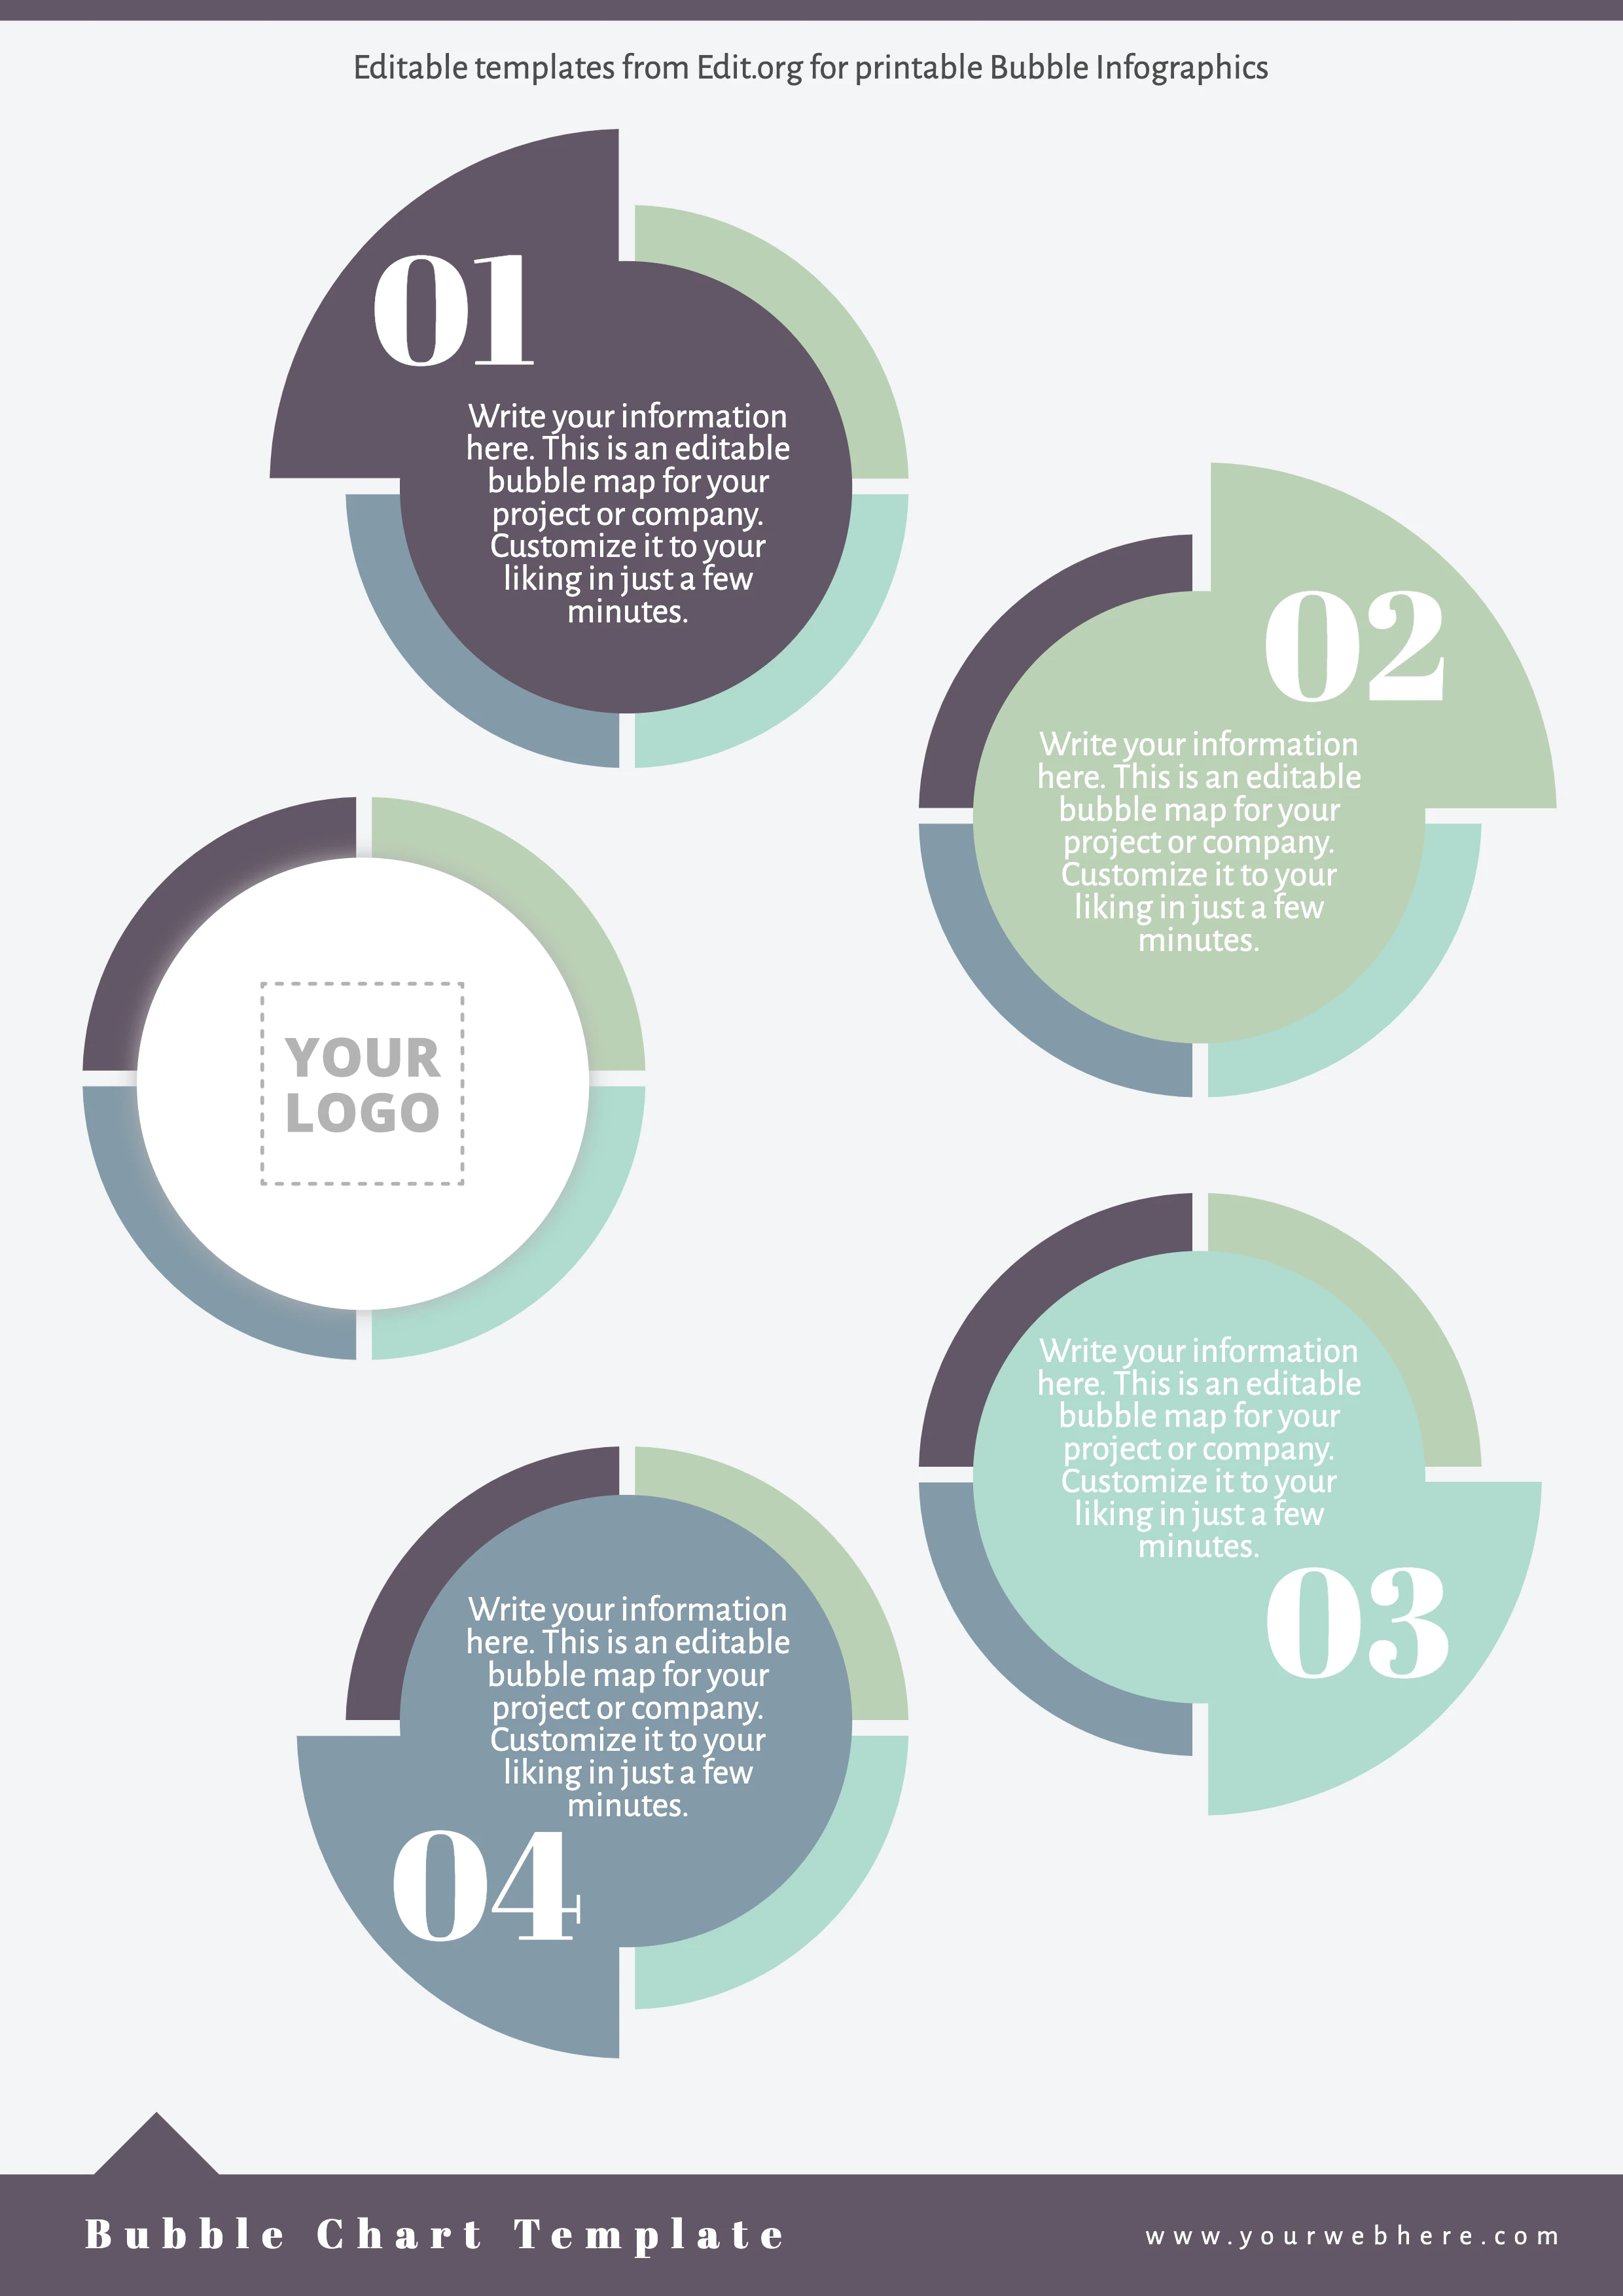
At Edit.org, discover the best bubble chart infographic templates ready to download in high resolution and perfect to be included in your professional reports.
Edit these bubble map examples from your cell phone, tablet, or computer without downloading any app. Just enter our free online editor and edit every aspect online and free: colors, fonts, logo, and whatever you need!
Make your bubble map ideas look elegant and professional. Gain credibility and stand out from the competition in the visual aspect. Also, create pie chart templates for your company.
How to make a Bubble Map design online
It's quick and easy:
- Click on a bubble mind map we show you in this article or go to the editor to get started.
- Edit the bubbles and information with your text and needs.
- Save your work in the online cloud that we generate for you. Make changes later and download the result in JPG, PDF, or PNG.
- Print or share your bubble chart diagram in the highest quality.
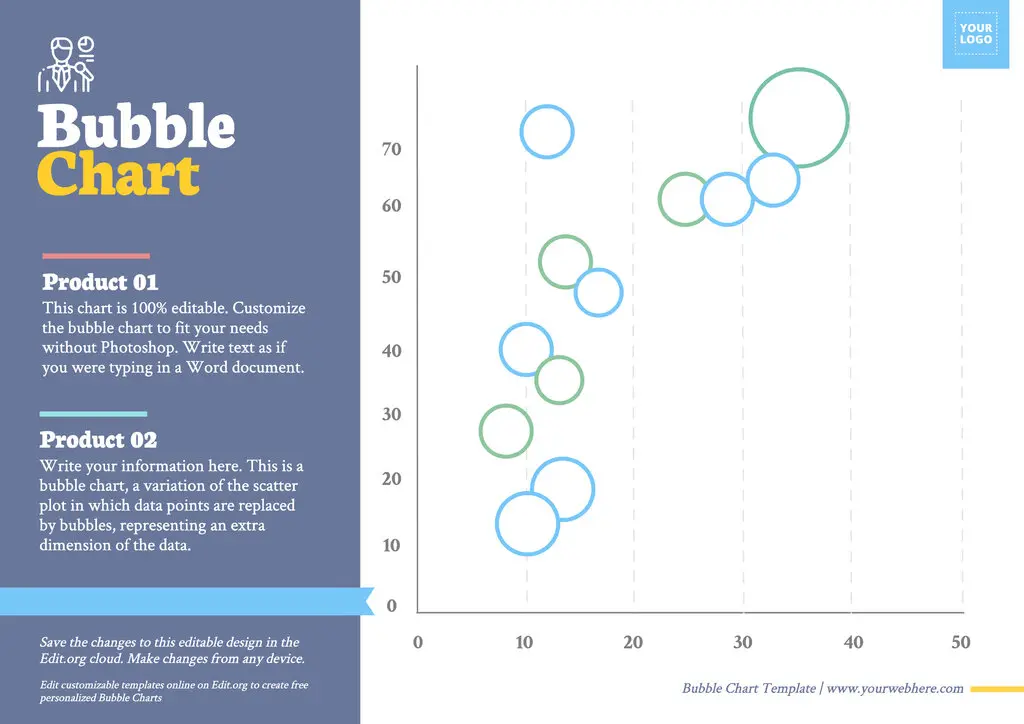
Here's a tip! You can use the size of the bubbles to represent a specific quantity or to compare data sets. This way, you can easily visualize differences in magnitudes.
Examples of Bubble Diagram in strategic management
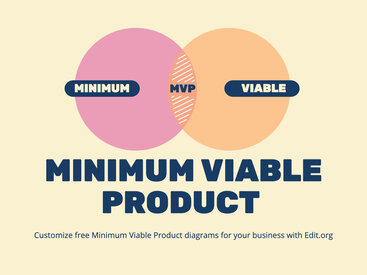
What is a Bubble Diagram? It is a diagram used to visualize data in three dimensions. This bubble concept map is composed of different bubbles or circles representing different variables. The size of each circle corresponds to the magnitude of a third variable.
You can use our customizable bubble infographic templates to show your financial data. For this purpose, we have created infographics in which the bubbles' diameter indicates the company size and their position on the xy-axis can represent other financial metrics.
Create a Bubble Map to download in seconds
Without PowerPoint or Excel, you can create the best bubble map for writing. Use our bubble diagram generator and achieve a perfect visual orientation.
Our pre-designs already include visual suggestions to tell you how to organize and present data effectively to your audience. Customization is very, very easy. You can adjust text, font sizes, legends, and other elements according to the specific needs of your data study.