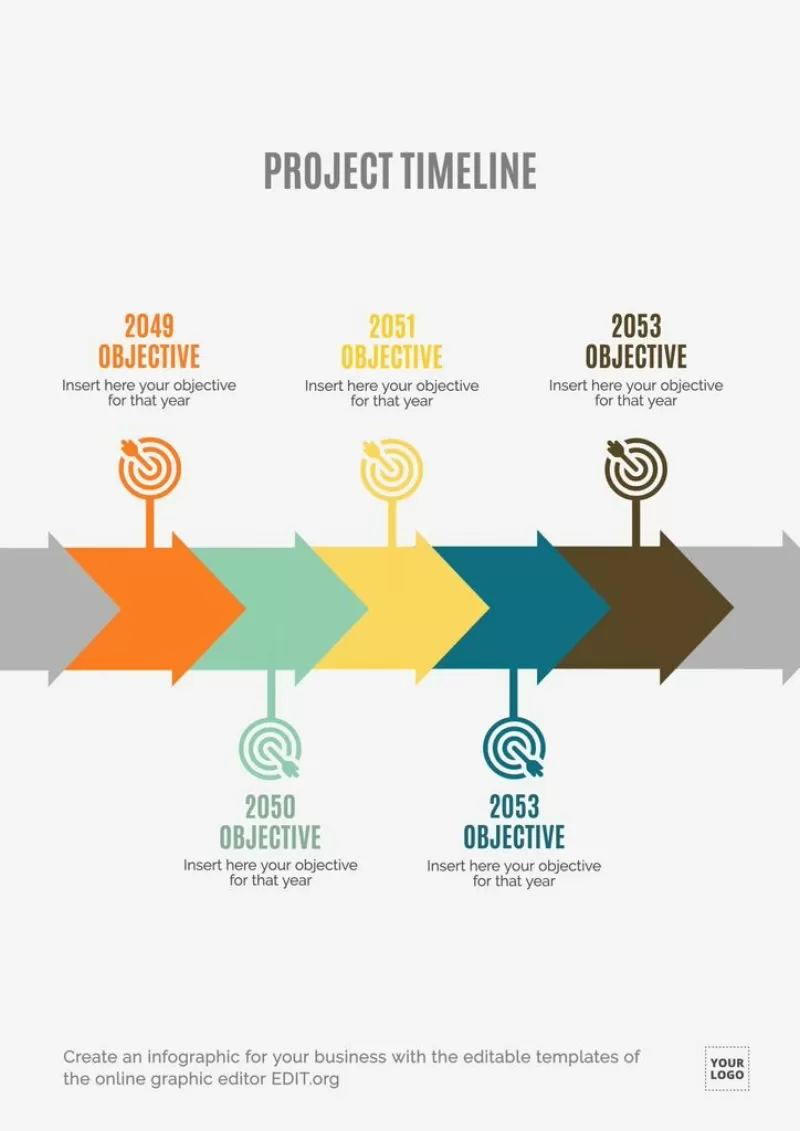
Create an infographic for your business with the editable templates on the online graphic editor, Edit.org
Create an infographic with editable design templates online
Infographics are very powerful visual communication tools. In a small space, they can visually synthesize the important aspects of a project, business, or company vision.
Creating an infographic can be time-consuming, but using our online editor's pre-designed editable templates will save you a lot of time and effort. There's a variety of design templates, and you can find shapes like bubbles, circles, pyramids, and funnels, as well as bar diagrams, thousands of copyright-free icons, and photographs from the Edit.org database. You can also find other canvas templates to start your project, such as Business Model canvas designs.
Types of infographics for your business
These are the most common types of infographics, from the most basic to the most elaborate:
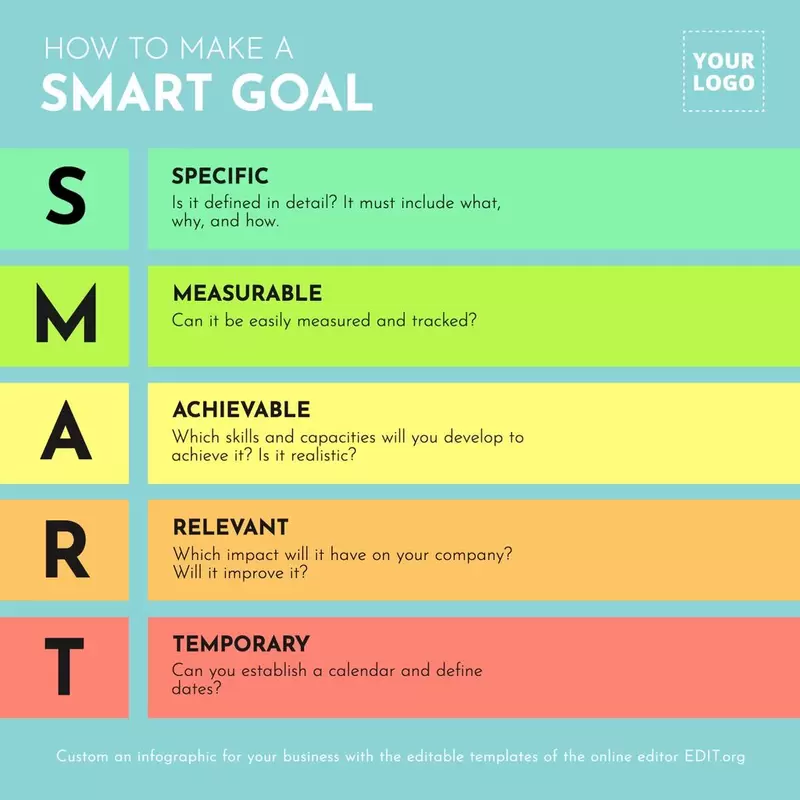
- List: It can be in vertical or horizontal order, numbered or unnumbered. The objective is to synthesize the main ideas, concepts, or steps to follow for a specific aspect in a few points. Lists are the simplest, but at the same time they're attractive, since they're visually appealing and easy to read.
- Chronology or Timeline: Similar to the list, but with a solid line to give the viewer a visual path to follow. This line can represent the passage of time, with various milestones marked, or it can be more conceptual, without indicating dates, but always in chronological order (factors or events that have a linear correlation).
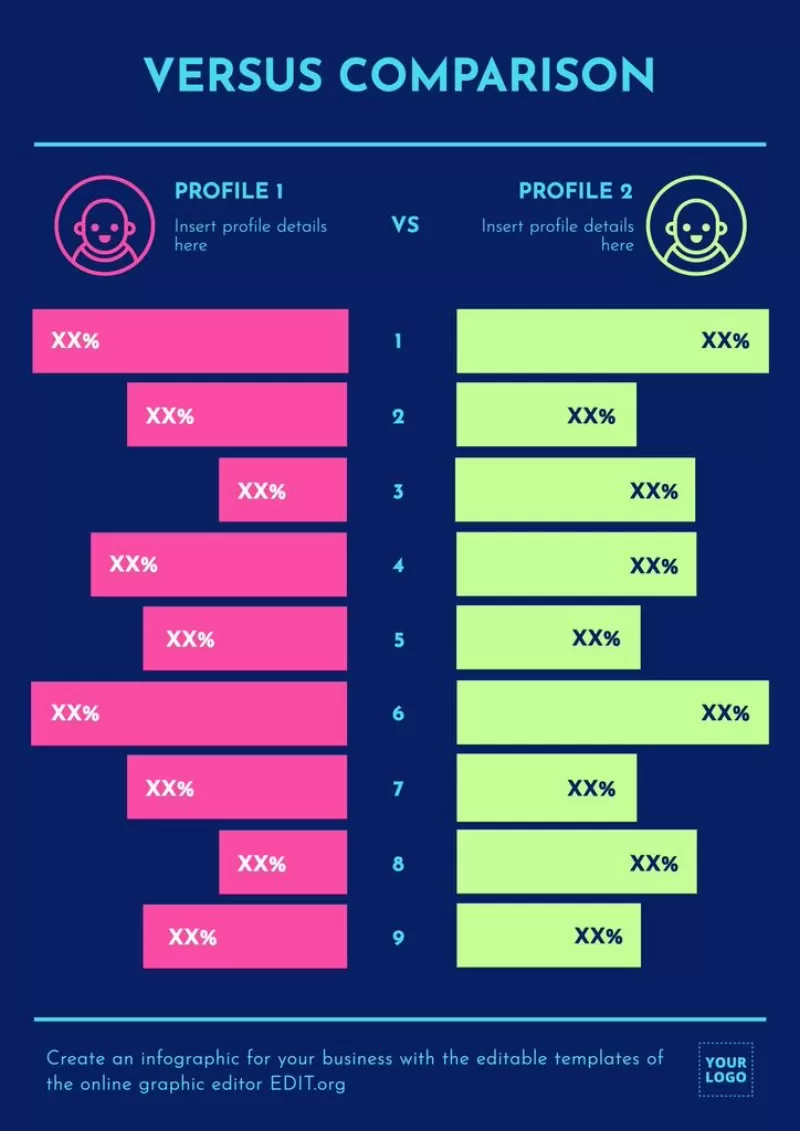
- Comparison: Comparing one element versus another is a widely used way of communicating or learning, both consciously and subconsciously. We understand the magnitude of things through comparisons we make with what we already know, so comparison is a very common communicative tactic that can help by providing references of size and scale. Comparisons can use images and texts, or be more complex, with data.
- Data Visualization: Sometimes it's not easy to retain numerical data, but putting it in a visual format increases retention, since we are beings with a lot of visual retention. The most basic and useful way is through the creation of numerical bars, where numerical data is compared and displayed over time. For example, you could use the evolution of the number of clients over time or some data from a market study.
- Flowchart: Unlike the chronology, in this diagram there are correlations, but they are divergent; that is, from one point, several can arise. For example, a family tree is a type of flowchart, since several children can emerge from one couple. Another example is a diagram of an industrial process, where several elements intervene and interrelate in a single point of the diagram to execute one part of the process. They are a type of infographic that helps a lot in understanding systems, processes, methodologies, and elements that all intervene. They aim to graphically simplify complex processes.
- Map: Locating data on a map helps create a geographical conception about the facts that are being discussed. Nowadays, people easily recognize the shape of their country, continent, or the whole world, so locating data in each zone is more powerful than creating a list of zone names with your data.
- Visual Item: It's a very elaborate type of infographic, that's actually the sum of several types of infographic content in the same document. We recommend starting with the most basic, and if the time comes, you can make a compendium of several images to form a larger one with a lot of information.
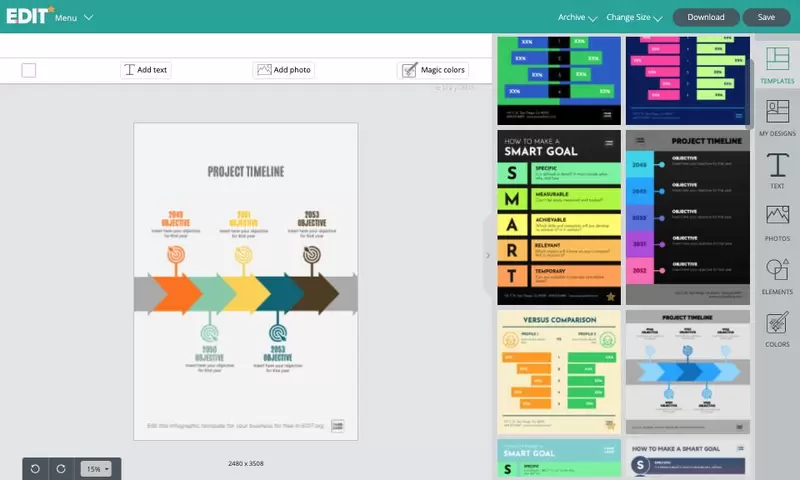
Designing an infographic with the Edit.org graphic editor is very easy
To create an infographic with our editor, you don't need to learn anything. You just have to follow these simple steps:
- Click on any image on this article.
- Select the infographic you want to use as the basis for your design.
- Edit the template to personalize it with your data and texts.
- Save changes online for later.
- Download your infographic in JPG, PNG, or PDF format.
That's it; you can now share your infographic online or print it!
Edit and customize the infographics in one click
The templates in our online editor Edit.org are all customizable. You can modify or adapt all its parts without any knowledge of graphic design:
- Modify the texts.
- Change the colors.
- Select your fonts.
- Upload your logo.
- Add geometric shapes.
- Resize any element.
And much more! Enter the online editor and give it a try—you'll be surprised by how easy it is to use.
Design digital infographics to print or share online
You can open a template and modify its size or proportion at any time with the "Change Size" button. The layout composition will automatically adapt to the new format without you having to redesign anything.
In this way, by designing your infographic only once, you can have the image in whatever format you want; to print on a poster or a flyer, to make a presentation with your work team, or to share online on corporate social networks.
Use the editable infographic templates and start synthesizing your ideas, achievements, and concepts in just a few clicks.