Customize a stacked bar chart template with clicks. Edit the best printable blank bar graphs to fill in. Create expert presentations for your reports, meeting minutes, and high-level studies.
Edit a free Bar Graph template in minutes
Want to create a bar chart outline with professional features? Whether you're a college student, a salesperson, or a marketing expert, you can adapt the designs in this article with a few simple clicks. Without using Photoshop, create elegant designs better than those produced with Excel.
Customize a bar graph infographic template with your phone, tablet, or computer. Go directly to our intuitive online graphic editor and design the best bar graph layout for startups, companies, and market research.
In a few minutes, you will have your bar diagram template ready to print in high quality and include in your work. You can also create other graphs such as Mekko diagrams.
How to customize an example of a Bar Chart
Look how easy it is to edit sample bar charts for schools and businesses:
- Click on any bar graph blank template in this article or go to the editor to get started.
- Customize your blank bar chart template with your data, logo, text, and elements. Click on each aspect you want to modify.
- Save the layout to your free Edit.org account if you want to make changes later.
- Download your simple bar chart template to share online in JPG, PNG, or PDF, or print it in full quality for a presentation.
That's it! It's easy to edit blank bar graphs to fill in from our free online editor.
Download a free printable blank Bar Graph template
A good presentation is vital for your report to be taken into account. Editing a professional bar graph outline is as easy as typing a text message on your cell phone. The result you get will be just like that of an expert designer.
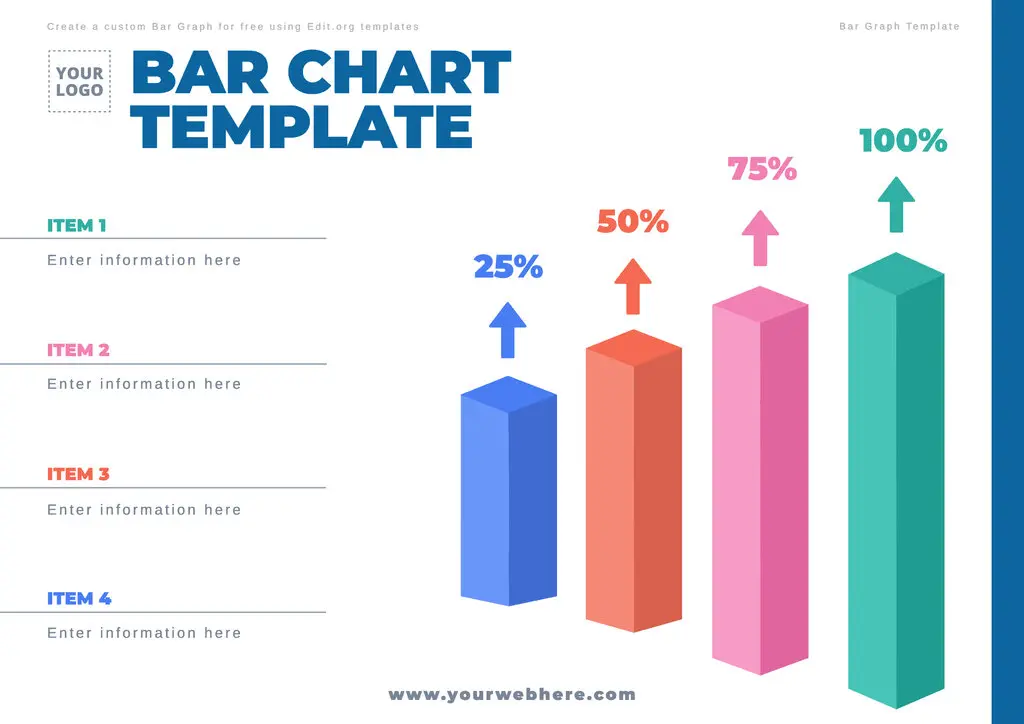
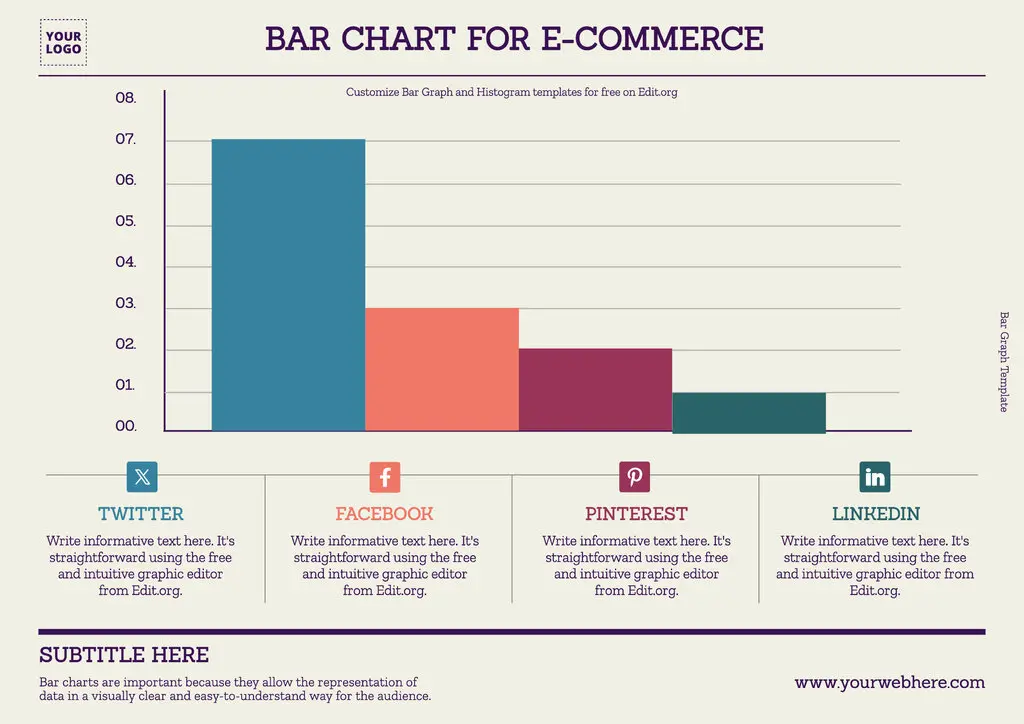
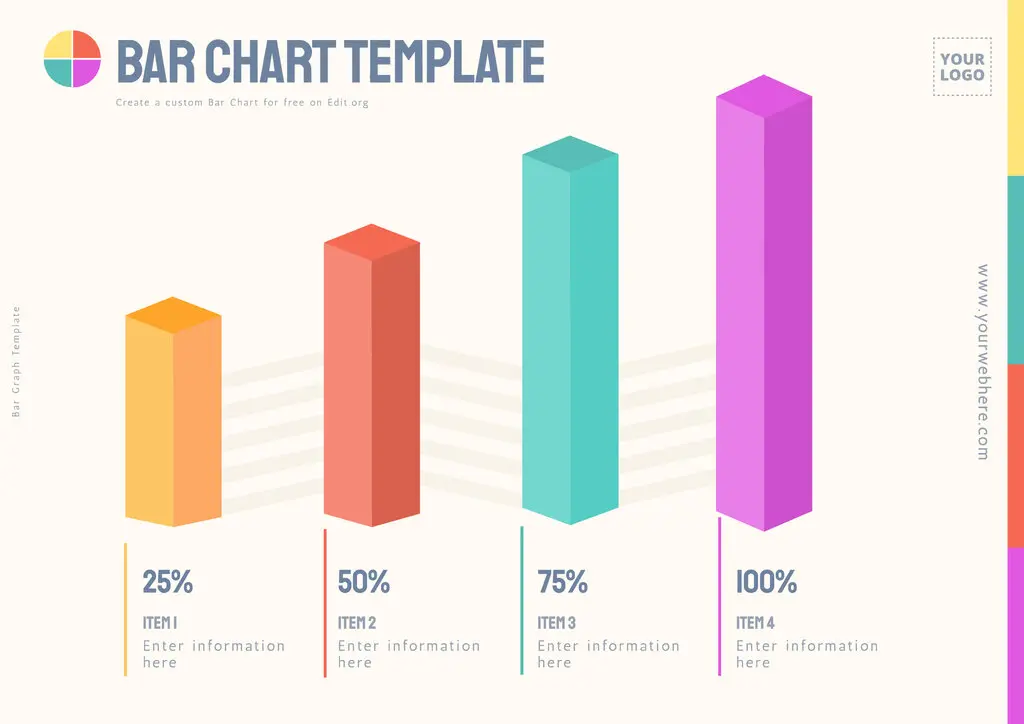
Customize a blank column graph template and show clients or colleagues your research results. Use our designs in different formats (horizontal or vertical) and from more complex to simpler.
You can also use these editable bar charts for educational purposes. This will help students' understanding of the data.
Create Powerpoint Bar Graph templates in seconds
In our free online editor, you can create in seconds and in an intuitive and fun way:
- Bar Histograms. They are mainly used in statistics to represent the distribution of a continuous variable. Use them to identify patterns, such as symmetry and concentration of data around specific values.
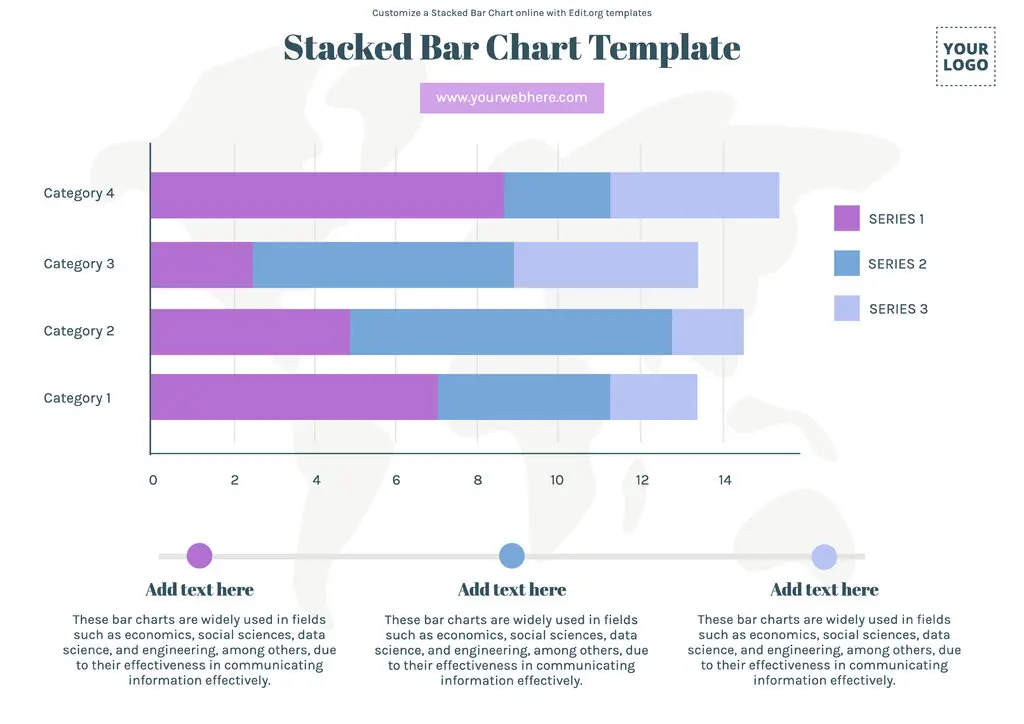
- Stacked Bar Charts. In these charts, the bars are stacked on top of each other rather than shown independently. They help compare different groups or subsets of data.
- Pie Charts. Pie charts are practical for showing relative proportions within a data set. However, it is vital to note that they can be less accurate when comparing small values.
Online free Column Chart maker
- What is a bar chart? They are a graphical tool for data analysis and communication of statistical results.
- What are bar charts for? They are used to compare different sets of information. They offer an intuitive and effective way to visualize data.
With the use of our predesigned bar and data circle templates, you will maximize the clarity and effectiveness of your data. Edit our bar charts with examples and improve your presentations and analysis in seconds! Enter our intuitive editor now.