Create your Ishikawa Diagram (cause and effect) with templates to edit online from our editor, with colors, fonts, and thousands of resources to use in completing your infographic.
Create an Ishikawa cause-and-effect diagram online for a presentation
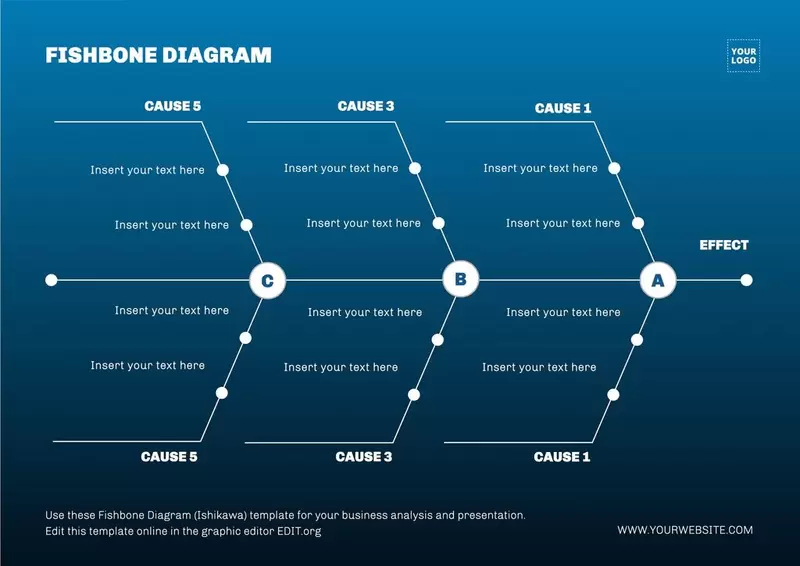
This type of infographic has a shape similar to a fish bone; it's a timeline where we add actions, processes, events, and/or resources (causes) that will produce certain results or problems (effects).
It can be very useful to analyze problems in the services or methodologies of a company and find their causes.
An example for a company:
We want to analyze the company's low productivity (the effect or result of a set of actions). In the timeline, we'll incorporate raw materials, labor along with environmental factors, methods used, machinery, etc. In the analysis, we can highlight which are the aspects that produce this undesirable result and then start looking for solutions.
Creating your first Ishikawa diagram is as easy as clicking on any of the images in this article.
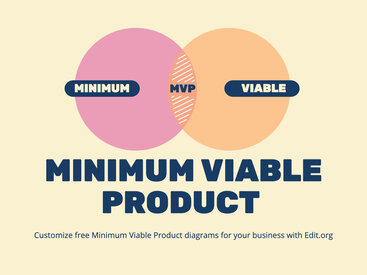
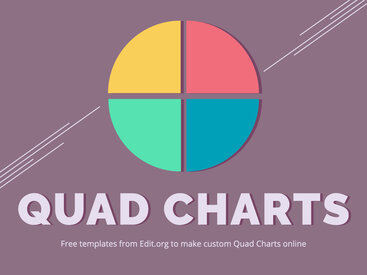
At Edit.org, you will find thousands of templates for other formats, matrices and diagrams, such as Venn Diagrams.
Use the Editable Fishbone Diagram Sample Templates
On our editor, you'll find spectacular designs for your diagram. You just have to choose the one you like the most, customize it, and download it to your device. You can:
- Modify or add titles, phrases, and text;
- Use your corporate colors and upload your logo;
- Upload your font or select the one you like the most;
- Save changes online;
- Download the diagram in JPG, PNG, or PDF.
In addition, you can save as many versions as you want and change the size in a single click.
Enter the editor now and create your cause and effect diagram with impressive editable designs online in just a few minutes.